FEM PostPipelineFromResult
This documentation is not finished. Please help and contribute documentation.
GuiCommand model explains how commands should be documented. Browse Category:UnfinishedDocu to see more incomplete pages like this one. See Category:Command Reference for all commands.
See WikiPages to learn about editing the wiki pages, and go to Help FreeCAD to learn about other ways in which you can contribute.
|
|
| Menu location |
|---|
| Results → Post pipeline from result |
| Workbenches |
| FEM |
| Default shortcut |
| None |
| Introduced in version |
| 0.17 |
| See also |
| FEM tutorial |
* You need a valid result object in the Analysis container, such as CalculiX static results.
Description
Pipeline is a result object, which creates a new graphical representation of FEM analysis results on the analysed part. It adds color scale and more display options.
Usage
- Select a result object
- Click
button, or click on menu Results → Post Pipeline from result. A new object called "Pipeline" will be added to your analysis.
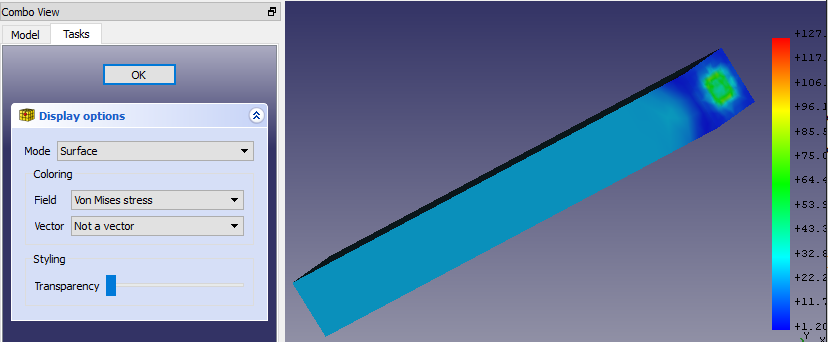
- Double-click the new Pipeline object in the tree view and select a display mode and the result field. For example for the mode Surface and the field Von Mises stress the pipeline will look like this:
If you see no model in the graphical area, go to and enable Edit → Preferences → Display → 3D View → Rendering → Backlight color.
Properties
This pipeline dialog has the following settings:
- Mode: How to draw the results. The possible modes are
- Outline: The outline of the result mesh. In fact is displays no results but only the borders of the mesh
- Nodes: The result mesh nodes
- Surface: This is the default and displays the surface of the result mesh.
- Surface with Edges: Like Surface but with the mesh outline edges and the surface mesh node connection lines.
- Field: Which result property to draw
- Vector: Is only active if the Field is a vector. You can select whether to display the vector Magnitude or its X, Y, Z components.
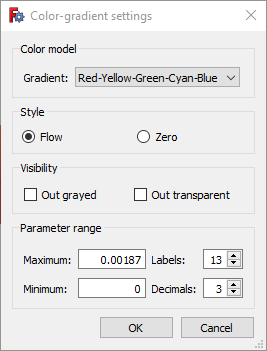
If you double-click the scale, you get this settings dialog:
and can modify these properties:
- Gradient: You can select reversed order of the default color gradient, Red-White-Blue, Black-White or White-Black.
- Style: The default option Flow uses the full color gradient range. The option Zero uses only the color gradient range starting form the color that would display the mean value to the maximum.
- Parameter range: Minimum and maximum values are filled-in automatically. You can modify them, however make sure you know what you are doing. You can also change the number of displayed decimal places and the number of labels distributed over the parameter range.
Limitations
Note that the Pipeline representation of the results (called VTK) on the displayed part is different from the color gradient results which are visible when you finish solution. Values in the gradient scale cannot be applied to the solution result object.
- Materials: Solid, Fluid, Nonlinear mechanical, Reinforced (concrete); Material editor
- Element geometry: Beam (1D), Beam rotation (1D), Shell (2D), Fluid flow (1D)
Constraints
- Electromagnetic: Electrostatic potential, Current density, Magnetization
- Geometrical: Plane rotation, Section print, Transform
- Mechanical: Fixed, Displacement, Contact, Tie, Spring, Force, Pressure, Centrif, Self weight
- Thermal: Initial temperature, Heat flux, Temperature, Body heat source
- Overwrite Constants: Constant vacuum permittivity
- Solve: CalculiX Standard, Elmer, Mystran, Z88; Equations: Deformation, Elasticity, Electrostatic, Electricforce, Magnetodynamic, Magnetodynamic 2D, Flow, Flux, Heat; Solver: Solver control, Solver run
- Results: Purge, Show; Postprocessing: Apply changes, Pipeline from result, Warp filter, Scalar clip filter, Function cut filter, Region clip filter, Contours filter, Line clip filter, Stress linearization plot, Data at point clip filter, Filter function plane, Filter function sphere, Filter function cylinder, Filter function box
- Additional: Preferences; FEM Install, FEM Mesh, FEM Solver, FEM CalculiX, FEM Concrete; FEM Element Types
- Getting started
- Installation: Download, Windows, Linux, Mac, Additional components, Docker, AppImage, Ubuntu Snap
- Basics: About FreeCAD, Interface, Mouse navigation, Selection methods, Object name, Preferences, Workbenches, Document structure, Properties, Help FreeCAD, Donate
- Help: Tutorials, Video tutorials
- Workbenches: Std Base, Arch, Assembly, CAM, Draft, FEM, Inspection, Mesh, OpenSCAD, Part, PartDesign, Points, Reverse Engineering, Robot, Sketcher, Spreadsheet, Surface, TechDraw, Test Framework
- Hubs: User hub, Power users hub, Developer hub

