Post-Processing of FEM Results with Paraview/ru: Difference between revisions
(Created page with "Для вычисления интегралов нам необходимо применить Integration Filter, который можно найти в пункте мен...") |
(Created page with "Нажмите кнопку {{Button|Apply}} на вкладке "Properties", и результаты откроются в отдельном окне справа от ок...") |
||
| Line 138: | Line 138: | ||
[[File:PVPic23.png|700px]] |
[[File:PVPic23.png|700px]] |
||
Нажмите кнопку {{Button|Apply}} на вкладке "Properties", и результаты откроются в отдельном окне справа от окна просмотра. |
|||
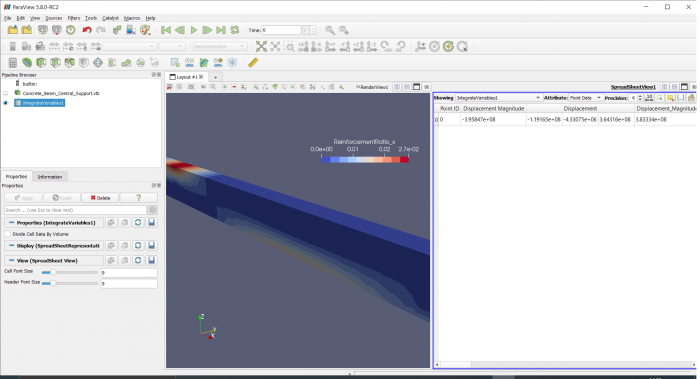
Press the {{Button|Apply}} button in the Properties tab and the results will open in a separate window to the right of the Renderview. |
|||
[[File:PVPic24.png|700px]] |
[[File:PVPic24.png|700px]] |
||
Revision as of 19:11, 7 December 2020
| Тема |
|---|
| Post-Processing of FEM Results with ParaView |
| Уровень |
| Intermediate |
| Время для завершения |
| 120 минут |
| Авторы |
| HarryvL |
| FreeCAD версия |
| 0.19 |
| Примеры файлов |
| beam и wall найденные в этих ветках форума FreeCAD |
| Смотрите также |
| None |
Введение
В некоторых сообщениях на форуме и учебных пособиях для просмотра и анализа результатов верстака FEM FreeCADа используется Paraview (PV). В этом руководстве объясняются основы передачи данных из верстака FEM в PV и показаны некоторые параметры и настройки для отображения данных.
Требования
- Версия FreeCAD, совместимая с указанной версией этого Руководства.
- Paraview, загруженный непосредственно с его веб-сайта, или через ваш менеджер пакетов.
- Это руководство основано на версии Paraview 5.8.0 для Windows, которая была самой последней версией на момент написания учебника.
- Файлы FreeCAD, используемые для этого руководства, доступны в этой и этой теме форума FreeCAD.
Передача данных из верстака FEM
В верстаке FEM выделите объект CCX_Results, затем используйте меню Файл > Экспортировать... > FEM result VTK (*.vtk *.vtu) для экспорта данных VTK.
Импорт данных в Paraview
На начальном экране отображается пустой Pipeline Browser. Здесь будут видны импортированные объекты данных VTK и примененные объекты фильтров (для геометрии или данных).
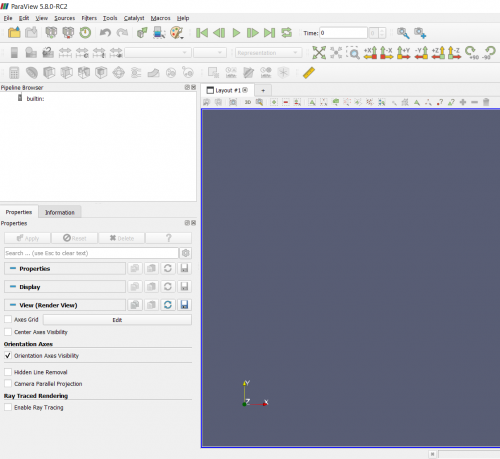
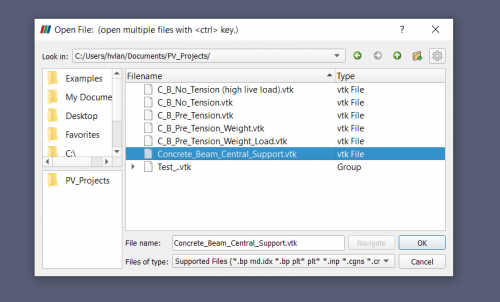
Используйте пункт меню File > Open > *.vtk, чтобы открыть файл VTK, созданный в верстаке FEM.
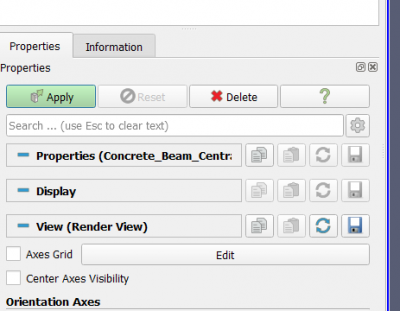
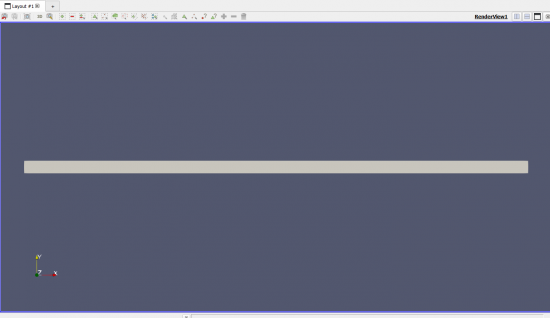
Нажмите Apply на вкладке свойств. По умолчанию это покажет вид геометрии сверху (взгляд вниз по оси Z).
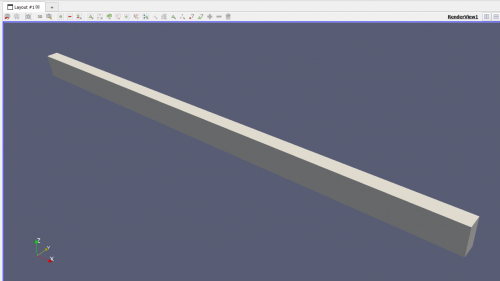
Геометрию серого цвета можно просмотреть, поворачивая вид. Левая кнопка мыши заставляет геометрию вращаться, но, к сожалению, это трудно контролировать (в сравнении с FreeCAD). Чтобы получить предсказуемый поворот, удерживайте клавишу X, Y или Z, перетаскивая мышь с нажатой левой кнопкой мыши, чтобы повернуть модель вокруг X, Y или Ось Z соответственно
Сохранение/загрузка состояния
Вместо сохранения данных Paraview сохраняет статус (состояние) действий, выполненных над импортированным объектом VTK. Поэтому для сохранения вашей работы используйте опцию меню File > Save State. ПРИМЕЧАНИЕ: при выходе из Paraview предупреждения для сохранения состояния не будет, и вся работа может быть потеряна при выходе.
Чтобы продолжить с того места, на котором вы остановились в предыдущем сеансе, используйте File > Load State. При этом пользователю предлагается указать файл VTK, что означает, что действия, выполненные в предыдущем сеансе, также могут быть применены к новому файлу VTK. Таким образом, данные из различных анализов верстака FEM, могут отображаться одинаково без дополнительных усилий.
Визуализация результатов из верстака FEM
Paraview имеет множество опций и настроек для отображения результатов. Сначала мы рассмотрим отображение базовых данных импорта для исходной геометрии, а затем посмотрим, как применять фильтры для изменения геометрии. Наконец, мы будем использовать калькулятор и фильтры интеграции для получения новых результатов путем объединения базовых данных импорта.
Базовые данные, отображаемые на исходной геометрии
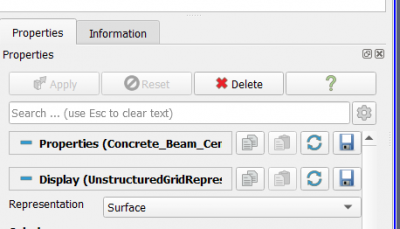
Поскольку обозреватель конвейера может содержать несколько объектов VTK и объектов фильтра, сначала убедитесь, что нужный объект VTK выделен в обозревателе конвейера. Выбор и настройки для отображения этого объекта VTK теперь можно найти на вкладке свойств. Чтобы убедиться, что все настройки видны и соответствуют этому руководству, нажмите кнопку «Advanced Settings» (значок шестеренки на рисунке ниже).
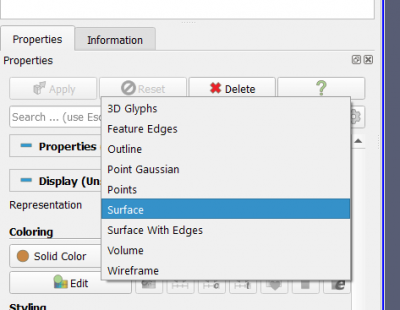
Первая настройка, которую мы можем изменить, - это способ представления данных в геометрии. Это делается в ниспадающем меню «Representation». Пока мы будем использовать только опцию Surface или Wireframe.
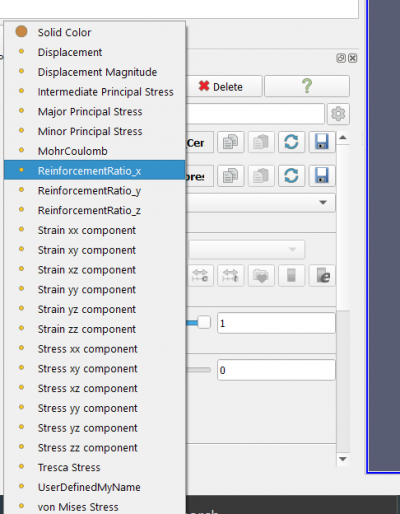
Пока результаты не отображаются. Для этого нам нужно изменить опцию Coloring. По умолчанию используется сплошной цвет (Solid Color), но в раскрывающемся меню отображаются все скалярные данные, доступные в импортированном файле VTK.
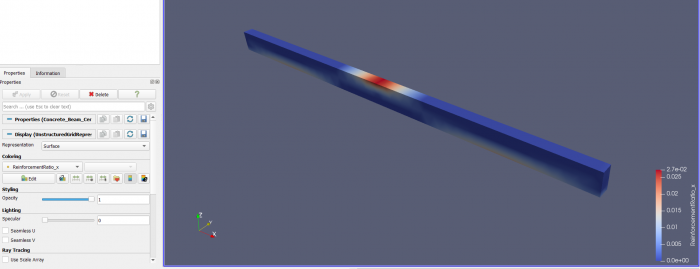
Для целей этого руководства мы выбираем ReinforcementRatio_x, но его легко изменить на любой тип данных.
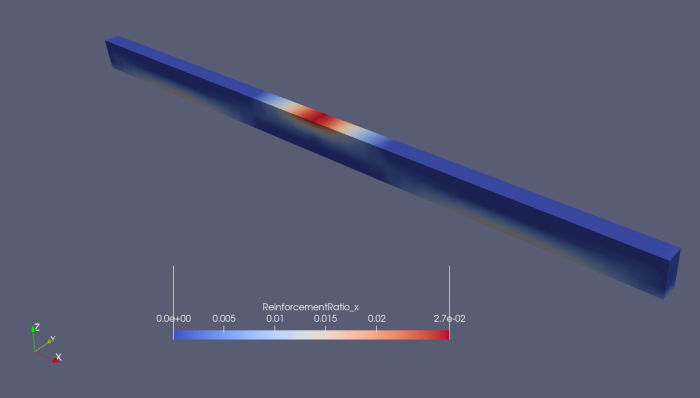
В окне RenderView теперь будет отображаться изо-график выбранного типа данных и цветовая легенда диапазона данных.
Цветовую легенду можно перетащить по экрану в более удобное место, и она изменит ориентацию при приближении к любому краю окна.
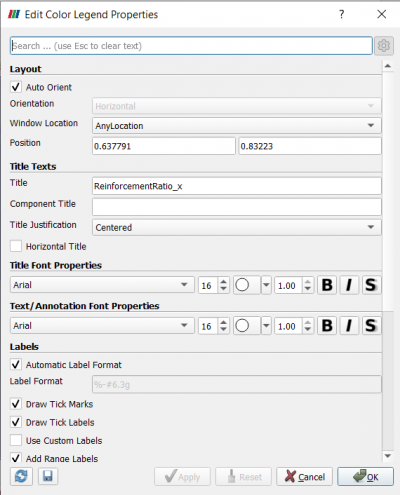
Кроме того, настройками цветовой легенды можно очень подробно управлять, открыв диалоговое окно «Редактировать свойства цветовой легенды» на вкладке «Свойства» (нажмите последний значок справа)
Это открывает следующее окно для настроек цветовой легенды.
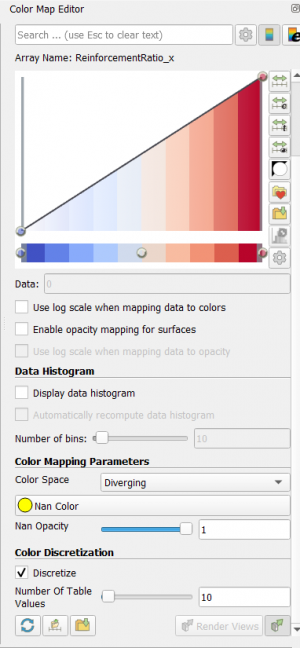
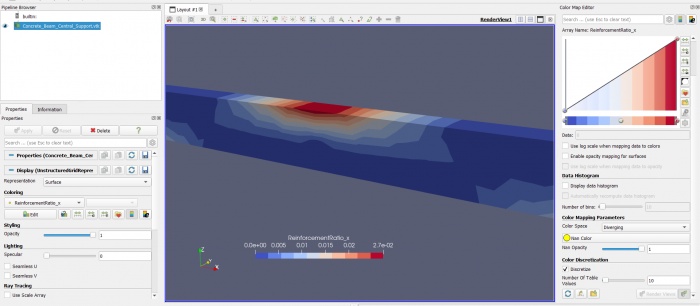
Раскраской iso-карты можно управлять через Color Map Editor, который активируется нажатием кнопки Edit на вкладке Properties:
Параметр «Color Discretization» полезен для ограничения количества значений ISO, тем самым создавая более практичные диапазоны для дизайна. По умолчанию количество диапазонов равно 256, но здесь установлено 10.
Применение фильтров к результатам верстака FEM
Для изменения базовых данных или геометрии, импортированных из верстака FEM, можно применять фильтры.
Здесь будут обсуждаться только фильтры Slice и Warp. Фильтры для создания составных результатов из базовых данных будут обсуждаться в следующем разделе.
Чтобы применить фильтр Slice, выделите объект VTK, который необходимо разрезать, и нажмите значок «Slice». Также можно найти фильтр «Slice» в меню «Filters > Alphabetical». Это добавляет объект фильтра Slice в Pipeline Browser, и расположение в древе показывает, что он применен к объекту VTK. Положение в древе имеет значение, потому что фильтры могут применяться к различным объектам VTK или даже к другим объектам фильтров. Объект фильтра нельзя перетаскивать в дереве, чтобы изменить объект, к которому он применяется. Целевой объект можно изменить только через меню (или щелкнув правой кнопкой мыши) пункт «Edit > Change Input».
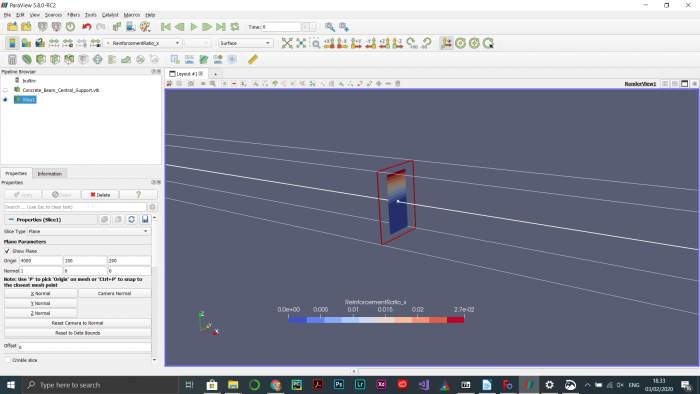
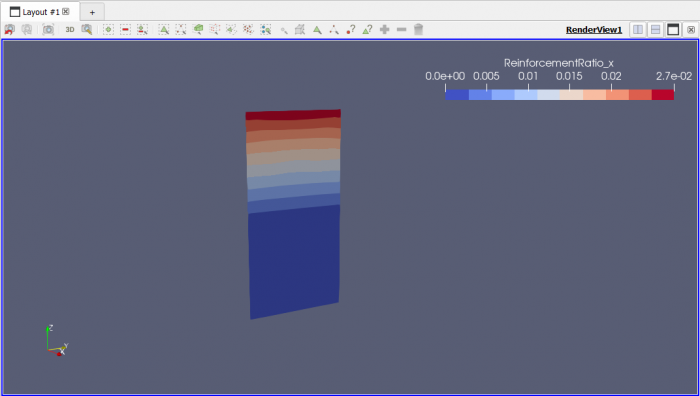
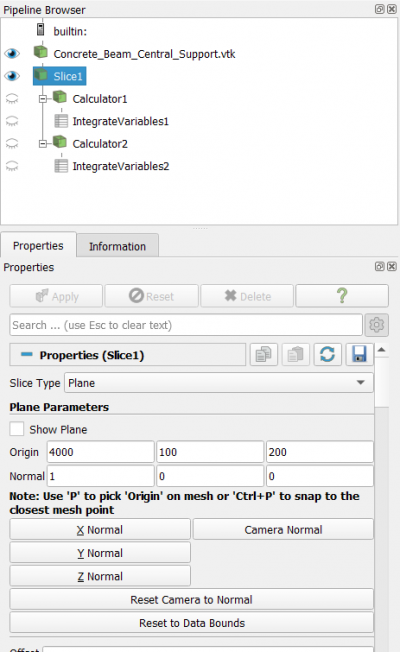
Расположение и ориентацию среза можно изменить, перетащив срез и его вектор нормали с помощью мыши или через вкладку Properties. На рисунке ниже начало среза размещено в центре балки (над центральной опорой), а нормаль к плоскости указывает на направление X.
Чтобы избавиться от ограничивающих рамок, снимите флажок «Show Plane» в верхней части диалогового окна «Plane Parameters».
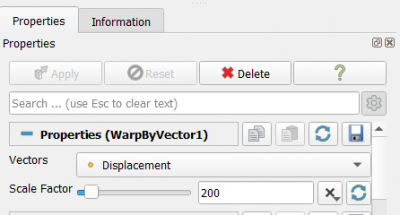
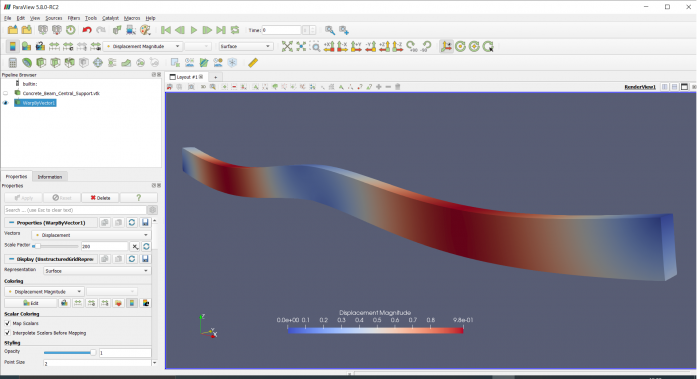
Фильтр «Warp by Vector» можно использовать для отображения деформированной геометрии. Выделите объект VTK и нажмите значок «Warp by Vector». Это добавляет фильтр в Pipeline Browser. Или найдите фильтр в меню «Filters > Alphabetical». Затем выберите «Displacement» в раскрывающемся меню «Vectors» на вкладке «Properties» и установите соответствующий масштабный коэффициент. Не забудьте нажать кнопку «Apply» после изменения настроек.
Максимальное значение смещения составляет 0,98 мм.
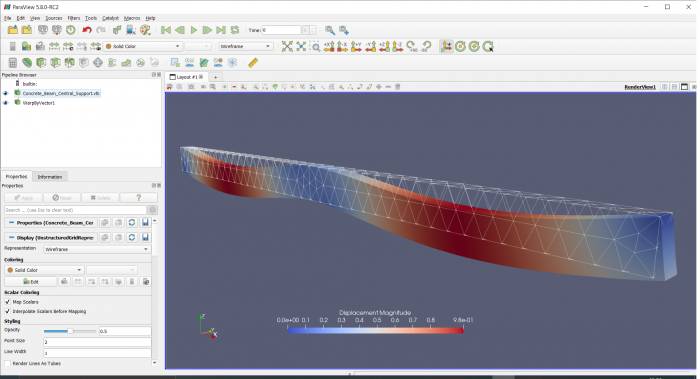
Чтобы отобразить деформированную геометрию, наложенную на недеформированную, просто сделайте видимыми объект VTK и объект фильтра Деформации, щелкнув значок глаза рядом с ним. На следующем рисунке параметр «Representation» для объекта VTK был изменен на «Wireframe», а Opacity уменьшена до 0,5, чтобы предотвратить скрытие деформированной геометрии.
ПРИМЕЧАНИЕ: по мере того, как в Pipeline Browser добавляется больше объектов и открывается больше окон отображения, становится все более важным убедиться, что в Pipeline Browser был выбран правильный объект, и при внесении изменений во вкладке "Properties" фокус имеет правильное окно. В противном случае можно потратить много времени на поиск нужного свойства, или изменения свойств могут не вступить в силу.
Применение фильтров для получения сложных результатов из базовых данных импорта
Если мы хотим узнать количество арматурной стали в балке в целом или количество, проходящее через конкретное поперечное сечение, нам необходимо выполнить интегрирование (суммирование по геометрии) базовых данных.
Например, общий объем стержней арматуры в балке, проходящей в направлении x, получается из интеграла INTEGRATE(ReinforcementRatio_x * dx * dy * dz) по всей геометрии и общей площади прохода арматурной стали, хотя конкретное поперечное сечение балки получается из INTEGRATE(ReinforcementRatio_x * dy * dz) по сечению.
В Paraview интегрированин можно выполнить с помощью Integration Filter. Этот фильтр можно применить ко всему объекту VTK (балке) или к Slice (поперечное сечение).
ПРИМЕЧАНИЕ: из-за несоответствия порядка узлов между FCFEM и PV, интегрирование по объему дает отрицательные результаты, то есть INTEGRATE( 1.0 * dx * dy *dz) = - Volume вместо + Volume.
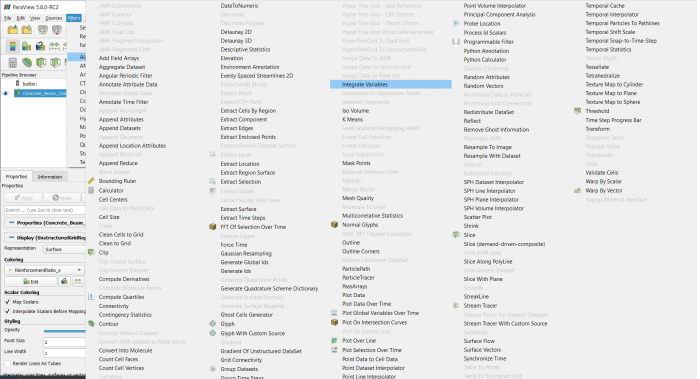
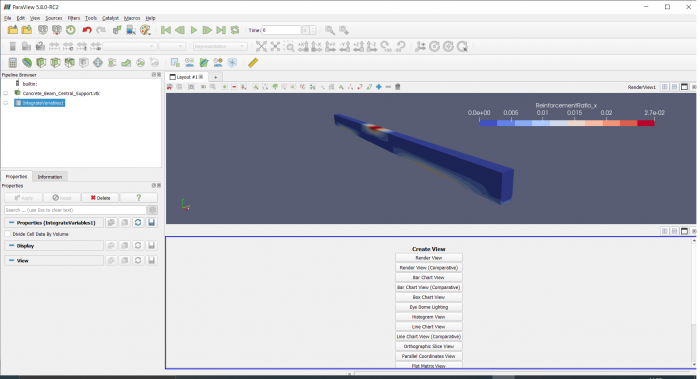
Для вычисления интегралов нам необходимо применить Integration Filter, который можно найти в пункте меню «Filters > Alphabetical». Выделите объект VTK и примените фильтр.
Нажмите кнопку Apply на вкладке "Properties", и результаты откроются в отдельном окне справа от окна просмотра.
Before we tidy this up to find the desired result, i.e. INTEGRATE(ReinforcementRatio_x * dx * dy * dz), lets first see how we can control where the window is placed and what it contains.
First close the SpreadSheetView window that has opened to the right. Then press the horizontal split icon on the Renderview window and a new window will open with a menu of display options. Before selecting an option, make sure the Integration filter object is highlighted in the Pipeline Browser.
To display numerical results we need to select SpreadSheet View at the bottom of the Create View list. This generates a spreadsheet of all available results in the VTK object integrated over the volume.
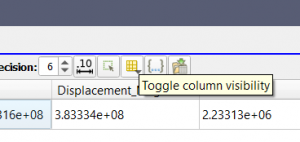
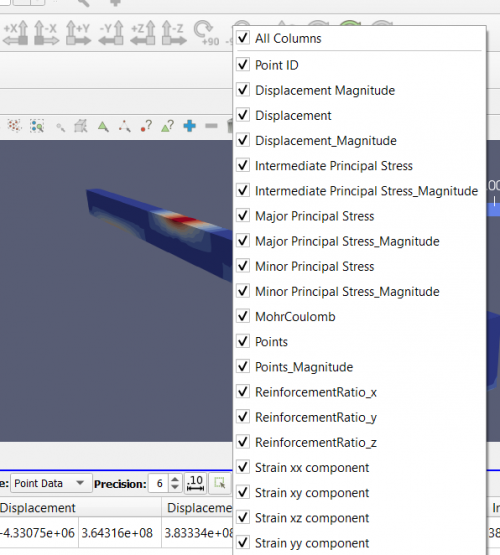
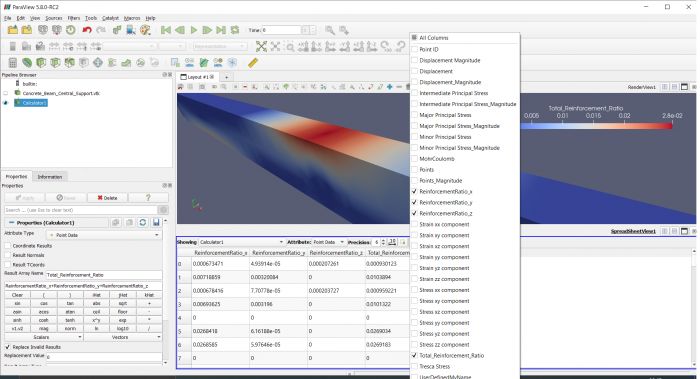
To inspect INTEGRATE(ReinforcementRatio_x * dx * dy * dz) we could scroll to the right through the table, but we can also remove all unwanted results by deselecting them, i.e. deselect All Columns and select ReinforcementRatio_x.
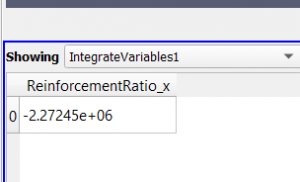
Now we are left with just one value in the table of integration results
As explained before this is the negative value of the integral we are looking for. So the indicative total volume of steel required in x direction is 2.27e+06 mm3 (= 2272 cm3) or 2272 cm3 * 7.6 g/cm3 = 17267 g (= 17.3 kg). In practice the number will be higher due to practical considerations (e.g. anchoring requirements, minimum reinforcement requirements, etc.). Nevertheless, this result can be used to compare conceptual designs
The above was an example of the integration of a variable directly exported by FEMWB. In some cases we may want to combine VTK variables to obtain new results. This can be done in several ways, but here I will only discuss the simplest, i.e. with the Calculator Filter.
For example, if we want to know the total reinforcement requirement in all three coordinate directions we would have to sum ReinforcementRatio_x, ReinforcementRatio_y and ReinforcementRatio_z.
The Calculator filter can be found as an icon on the left of the filter bar or via the menu Filters > Alphabetical. The name for the resulting variable can be entered in field Result Array Name. Here we name the result Total_Reinforcement_Ratio. The formula can be composed in the box below the Result Array Name field. Input values can be selected from the Scalars drop down menu and they can be combined into a formula for the result using the operators given. After pressing the Apply button, the result will be available as a new variable in any subsequent operations (e.g. an Integration Filter) or views (e.g. RenderView or SpreadSheetView, see below).
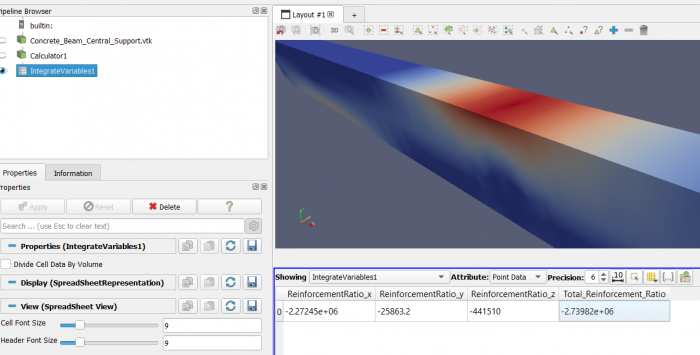
For example, we can now apply the integration filter to the new variable Total Reinforcement Ratio
This shows how the total reinforcement requirement compares to those in the individual coordinate directions.
Integration over a Slice
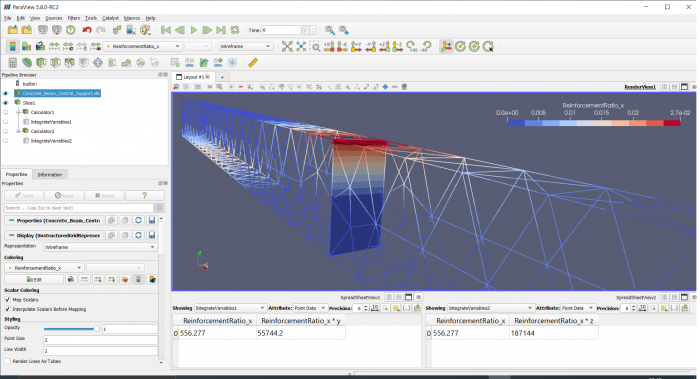
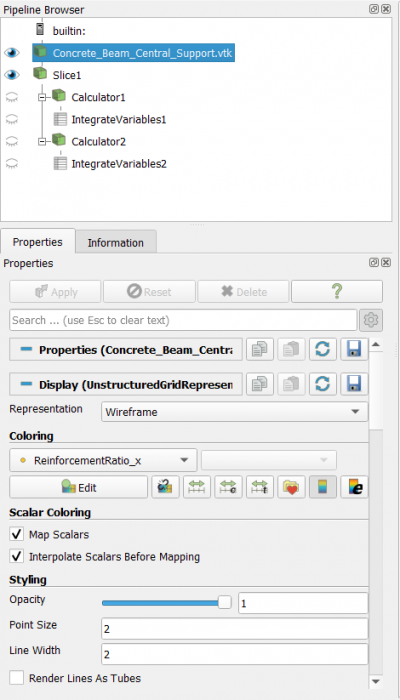
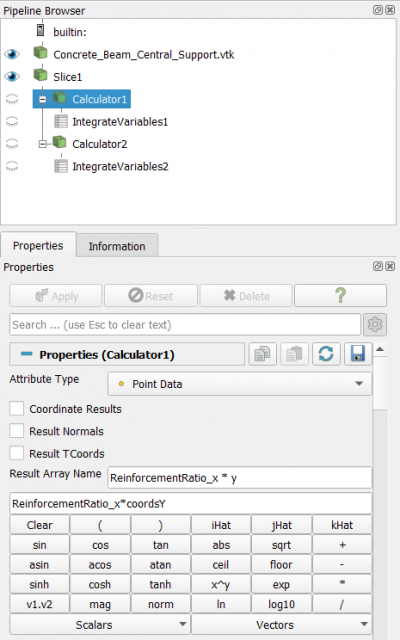
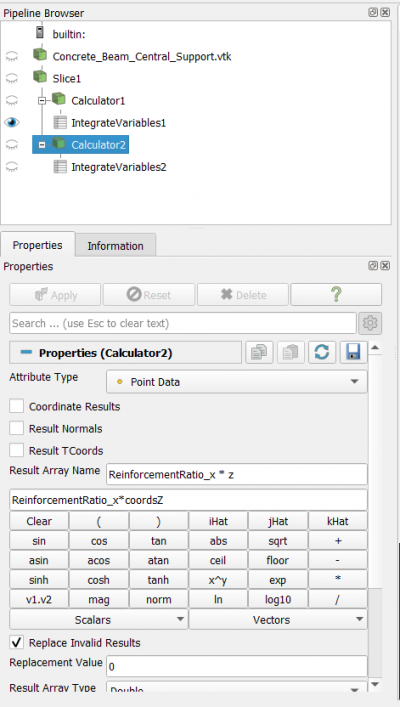
In the previous section we discussed the Integration filter and its application to the entire VTK object. To demonstrate integration over a slice we will in this section determine the total reinforcement requirement and its center of gravity for the central cross section of the beam. The end result is shown in the picture below. The interaction of various objects can be inspected in the Pipeline Browser. The slice filter is applied to the beam VTK object and two Calculator filters are applied to the slice filter to derive the new variables “Reinforcement_ratio_x * z” and “Reinforcement_ratio_x * y” from the base data. These variables need to be integrated to determine the center of gravity of the reinforcement. Finally, Integration filters are applied to each Calculator to integrate results over the Slice. Please refer to the previous section for a general introduction of the Integration filter and its settings.
Apply the following Settings in the Properties tab for the VTK object:
| Properties Tab Settings | Comment |
|---|---|
| Representation: Wireframe | So the Slice is visible |
| Coloring: ReinforcementRatio_x | Or any other color |
| Styling > Line Width: 2 | Or any other setting that gives a pleasing result |
Next highlight the VTK object and apply a Slice filter with the following settings on the Properties tab:
| Properties Tab Settings | Comment |
|---|---|
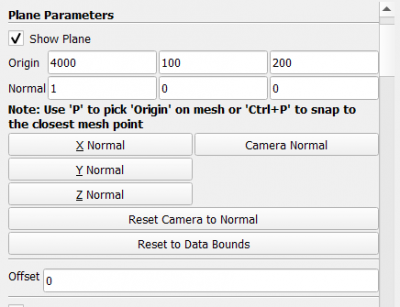
| Plane Parameters > Show Plane: deselect | Remove the bounding boxes |
| Plane Parameters > Origin: 4000 / 100 / 200 | Position of central section |
| Plane Parameters > Normal: 1 /0 /0 | Normal of Slice points in x -direction |
| Coloring: ReinforcementRatio_x | Optional |
| Styling > Line Width: 2 | Or any other setting that gives a pleasing result |
Settings Calculator 1
Calculator 1 computes the new variable ReinforcementRatio_x * y which needs to be integrated to obtain the y-coordinate of the reinforcement’s center of gravity.
After pressing Apply, a new variable named “ReinforcementRatio_x * y” is available for display or further processing.
Settings Calculator 2
Calculator 2 computes the new variable ReinforcementRatio_x * z which needs to be integrated to obtain the z-coordinate of the reinforcement’s center of gravity.
After pressing Apply, a new variable named “ReinforcementRatio_x * z” is available for display or further processing.
Finally, two Integration filters are applied, one on Calculator1 to integrate variable ReinforcementRatio_x * y and on Calculator2 to integrate ReinforcementRatio_x * z. Each are displayed in their own window with SpreadSheetView selected. The way to deselect all other results is explained earlier.
Finally the Center of Gravity can be calculated from the above results as:
CoG_y = 55744.2 / 556.277 = 100.2 mm (exact value: 100 mm)
CoG_z = 187144 / 556.277 = 336.4 mm (exact value: 5/6 * 400 mm)
Integration over a Line
To demonstrate visualisation and integration of results over a line we use the 2D example of a heavy wall as introduced in this FC forum thread. The FreeCAD file for this example can be downloaded in this FC forum thread. The challenge is to visualise reinforcement ratio across various vertical cross sections and to determine the required area of steel from integration of those results.
Techniques introduced in previous sections of this tutorial will not be repeated here. It is also important to note again that as more objects are added to the Pipeline Browser and more display windows are open, it becomes increasingly important to ensure that the right object is selected in the Pipeline Browser and the right Window has focus when making changes to the Properties Tab. Otherwise much time can be spent on finding the right property or changes to properties may not seem to take effect.
Starting with the VTK object imported from FEMWB we note that the PV controls operate slightly differently on a 2 dimensional object. The left mouse button drags the geometry and the middle mouse button rotates it. To position the geometry in the plane of analysis (i.e. x-y), press the icon that puts the view along the negative z axis:
For the picture below the Coloring property on the Properties tab for the VTK object was set to ReinforcementRatio_x.
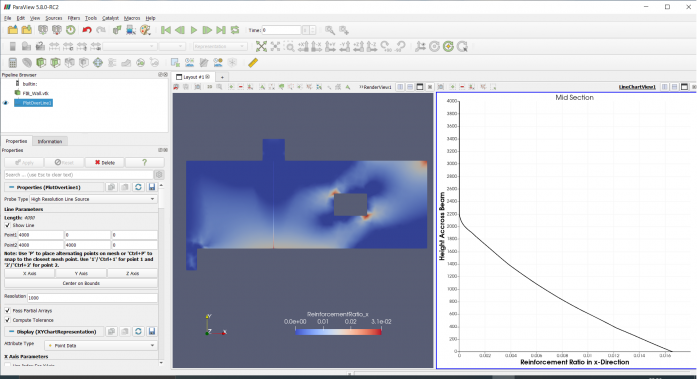
The only additional object required to visualise a variable along a straight line is a Plot Over Line filter. This can be activated from the icon bar or the menu option Filters > Alphabetical.
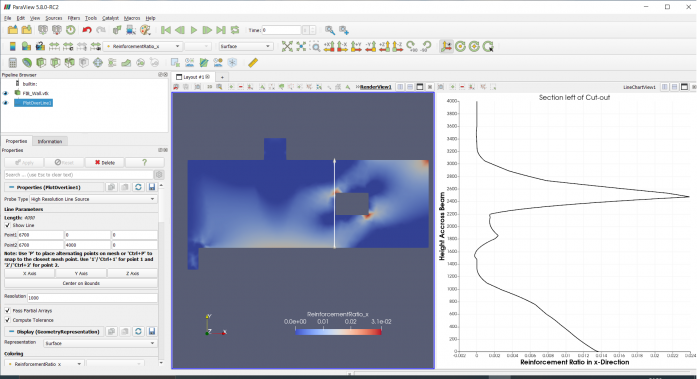
We next want to display the horizontal reinforcement requirements in the vertical cross section under the column. To achieve this in the way shown below, the following settings need to be changed in the Properties tab of the Plot Over Line filter (make sure the LineChartView window and the Plot Over Line object both have the focus)
| Properties Tab Settings | Comment |
|---|---|
| Line Parameters > Point 1: 4000 / 0 / 0 | Point at bottom of wall under the column |
| Line Parameters > Point 2: 4000 / 4000 / 0 | Point at top of wall under the column |
| x Axis Parameters > x Array Name: ReinforcementRatio_x | Displays ReinforcementRatio_x on the horizontal axis |
| Series Parameters: tick “arc length” only | This is the length parameter along the line |
| Title > Chart Title: Mid Section | |
| Annotation > Show Legend: deselect | Meaningless for the current choice of vertical axis |
| Left Axis > Left Axis Title: Height Across Beam | |
| Left Axis Range > Use Custom Range: deselect | Deselect to maximise the data range along the axis |
| Bottom Axis > Bottom Axis Title: Reinforcement Ratio in x-Direction | |
| Bottom Axis Range > Use Custom Range: deselect | Deselect to maximise the data range along the axis |
Note that the distance along the line (arc length) is usually on the horizontal axis and the variable that we want to display (here ReinforcementRatio_x) on the vertical axis. However, as the wall section in this example is vertical and we want to see the reinforcement requirement over the height of the wall, it is more natural to inverse the axes. This, however, comes at the expense of a lot more changes to the settings in the Properties tab for the Plot Over Line filter.
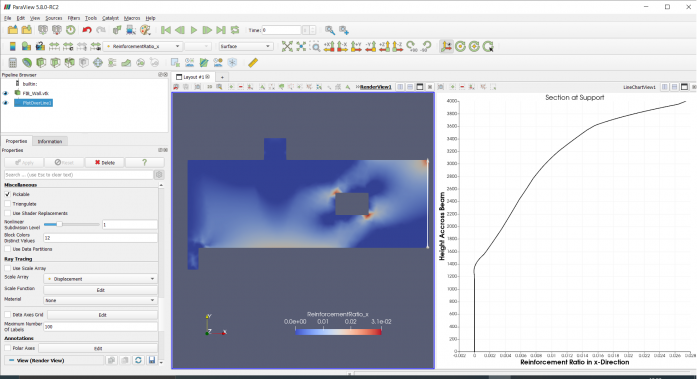
In the next two picture only the location of the line was changed. Note however that this relocation will automatically change the Left Axis Range > Use Custom Range setting to “select”. This may mean that the graph does not properly fit in the LineChartView window. It is therefore necessary to deselect this option every time the position of the line is changed. Other settings are as per the above table.
| Properties Tab Settings | Comment |
|---|---|
| Line Parameters > Point 1: 6700 / 0 / 0 | Point at bottom of wall under left side of cut-out |
| Line Parameters > Point 2: 6700 / 4000 / 0 | Point at top of wall above left side of cut-out |
| Title > Chart Title: Section left of Cut-out | |
| Left Axis Range > Use Custom Range: deselect | Deselect to maximise the data range along the axis |
| Bottom Axis Range > Use Custom Range: deselect | Deselect to maximise the data range along the axis |
| Properties Tab Settings | Comment |
|---|---|
| Line Parameters > Point 1: 10950 / 0 / 0 | Point at bottom of wall at right-hand support |
| Line Parameters > Point 2: 10950 / 4000 / 0 | Point at top of wall at right-hand support |
| Title > Chart Title: Section at Support | |
| Left Axis Range > Use Custom Range: deselect | Deselect to maximise the data range along the axis |
| Bottom Axis Range > Use Custom Range: deselect | Deselect to maximise the data range along the axis |
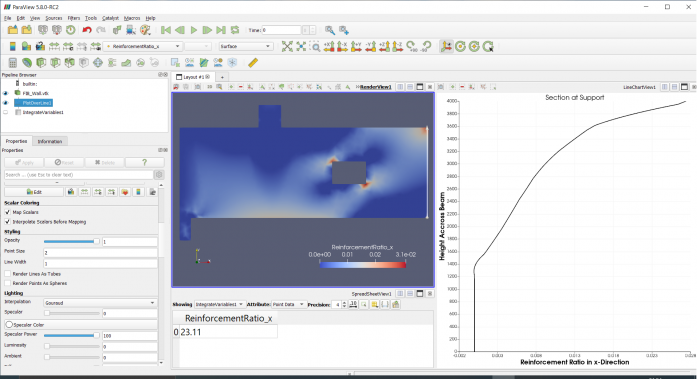
The total horizontal reinforcement requirement in the last cross section can now simply be obtained by applying an Integration filter to the Plot Over Line object, i.e. highlight the Plot Over Line object in the Pipeline Browser and add an Integration filter from the menu option Filters > Alphabetical.
In the usual way deselect all but the ReinforcementRatio_x result in the SpreadSheetView and read off the result as 23.11 mm2 / mm. To obtain the total cross sectional area of steel, we still need to multiply with the thickness of the wall, which in this example is (an impressive) 600 mm. So the total cross sectional area of steel running through the cross section near the right hand support is 23.11 * 600 = 13866 mm2 = 139 cm2
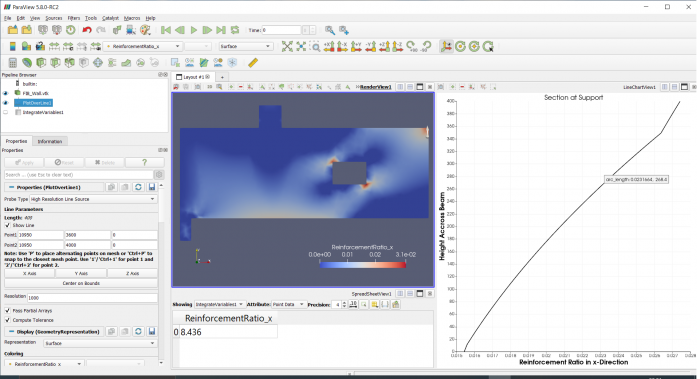
To achieve a more practical distribution of reinforcement we could integrate the above graph in parts. For example, if we want to know the required cross sectional area of steel in the top 400mm of the wall then we should adjust the properties of the Plot Over Line object as follows
| Properties Tab Settings | Comment |
|---|---|
| Line Parameters > Point 1: 10950 / 3600 / 0 | Point near top of wall at right-hand support |
| Line Parameters > Point 2: 10950 / 4000 / 0 | Point at top of wall at right-hand support |
| Left Axis Range > Use Custom Range: deselect | Deselect to maximise the data range along the axis |
| Bottom Axis Range > Use Custom Range: deselect | Deselect to maximise the data range along the axis |
This yields the following result
The result for the top 400 mm of the wall is thus 8.436 mm2 / mm. So the top 10% of the wall requires 8.44 / 23.11 * 100% = 37% of the reinforcement steel.
This procedure could be repeated to divide the wall in zones of constant reinforcement.
Representation of Vector Results with the Glyph 3D Filter
So far we have only dealt with Scalar values, like reinforcement ratio and displacement magnitude. Visualization of vector results, like Principal Stress vectors, is done with Glyphs.
Let’s return to the VTK data object for the beam with central support and visualize maximum and minimum principal stress vectors.
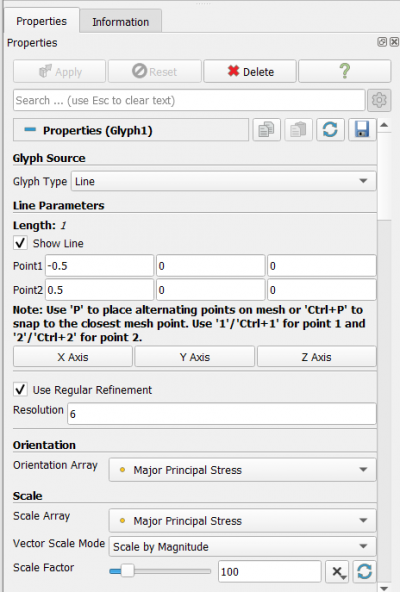
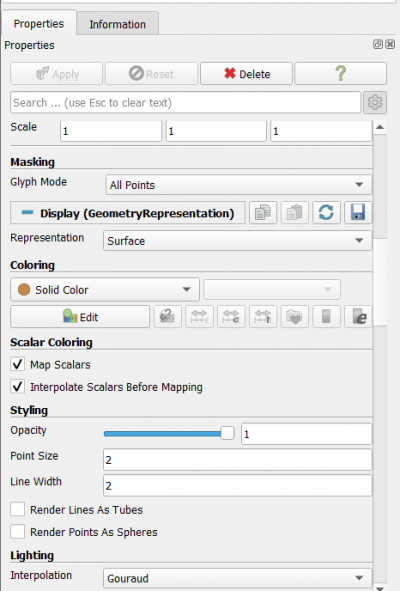
Highlight the VTK data object in the Pipeline Browser and select the Glyph Filter from the Filter Icon bar or from the menu option Filter > Alphabetical. Then apply the following settings in the Properties tab of the Glyph Filter object (see table and picture):
| Properties Tab Settings | Comment |
|---|---|
| Glyph Source > Glyph Type: Line | Unfortunately there is no option for a double sided arrow |
| Orientation > Orientation: Major Principal Stress | The Glyph takes the principal stress direction |
| Scale > Scale Array: Major Principal Stress | The length of the line will represent the magnitude of the principal stress |
| Scale > Vector Scale Mode: Scale by Magnitude | |
| Scale > Scale Factor: 100 | Or any other setting that gives a pleasing result |
| Masking > Glyph Mode: All Points | To make sure the stress in every node is displayed |
| Coloring > Solid Color | A single color gives greatest clarity of “stress flow” |
| Coloring > Edit > Green | Or any other setting that gives a pleasing result |
| Styling > Line Width > 2 | Or any other setting that gives a pleasing result |
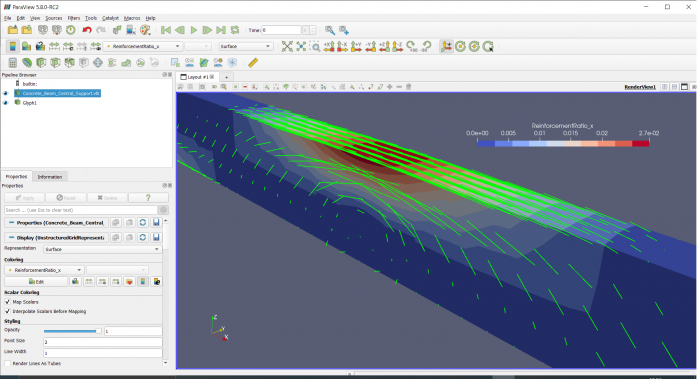
If all goes well you should see the following result for the example file.
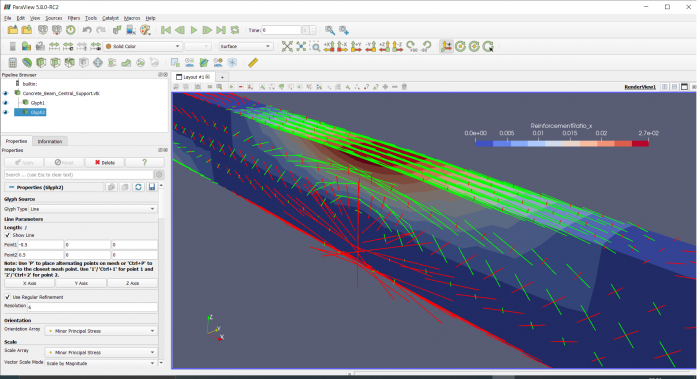
Next add another Glyph Filter with the following settings for the Minor Principal Stress (don’t forget to first highlight the VTK data object in the Pipeline Browser):
| Properties Tab Settings | Comment |
|---|---|
| Glyph Source > Glyph Type: Line | Unfortunately there is no option for a double sided arrow |
| Orientation > Orientation: Minor Principal Stress | The Glyph takes the principal stress direction |
| Scale > Scale Array: Minor Principal Stress | The length of the line will represent the magnitude of the principal stress |
| Scale > Vector Scale Mode: Scale by Magnitude | |
| Scale > Scale Factor: 100 | Or any other setting that gives a pleasing result |
| Masking > Glyph Mode: All Points | To make sure the stress in every node is displayed |
| Coloring > Solid Color | A single color gives greatest clarity of “stress flow” |
| Coloring > Edit > Red | Or any other setting that gives a pleasing result |
| Styling > Line Width > 2 | Or any other setting that gives a pleasing result |
The final result shows the major and minor principal stress vectors superimposed on the beam with ReinforcementRatio_x.
Export of Graphical Results
To export a RenderView window highlight the window and use menu option File > Save Screenshot Template:Tutorials navi/ru
- Materials: Solid, Fluid, Nonlinear mechanical, Reinforced (concrete); Material editor
- Element geometry: Beam (1D), Beam rotation (1D), Shell (2D), Fluid flow (1D)
Constraints
- Electromagnetic: Electrostatic potential, Current density, Magnetization
- Geometrical: Plane rotation, Section print, Transform
- Mechanical: Fixed, Displacement, Contact, Tie, Spring, Force, Pressure, Centrif, Self weight
- Thermal: Initial temperature, Heat flux, Temperature, Body heat source
- Overwrite Constants: Constant vacuum permittivity
- Solve: CalculiX Standard, Elmer, Mystran, Z88; Equations: Deformation, Elasticity, Electrostatic, Electricforce, Magnetodynamic, Magnetodynamic 2D, Flow, Flux, Heat; Solver: Solver control, Solver run
- Results: Purge, Show; Postprocessing: Apply changes, Pipeline from result, Warp filter, Scalar clip filter, Function cut filter, Region clip filter, Contours filter, Line clip filter, Stress linearization plot, Data at point clip filter, Filter function plane, Filter function sphere, Filter function cylinder, Filter function box
- Additional: Preferences; FEM Install, FEM Mesh, FEM Solver, FEM CalculiX, FEM Concrete; FEM Element Types
- Начинающим
- Установка: Загрузка, Windows, Linux, Mac, Дополнительных компонентов, Docker, AppImage, Ubuntu Snap
- Базовая: О FreeCAD, Интерфейс, Навигация мыши, Методы выделения, Имя объекта, Настройки, Верстаки, Структура документа, Свойства, Помоги FreeCAD, Пожертвования
- Помощь: Учебники, Видео учебники
- Верстаки: Std Base, Arch, Assembly, CAM, Draft, FEM, Inspection, Mesh, OpenSCAD, Part, PartDesign, Points, Reverse Engineering, Robot, Sketcher, Spreadsheet, Surface, TechDraw, Test Framework
