FEM Pipeline de résultats
|
|
| Emplacement du menu |
|---|
| Results → post pipeline from result |
| Ateliers |
| FEM |
| Raccourci par défaut |
| Aucun |
| Introduit dans la version |
| 0.17 |
| Voir aussi |
| FEM Tutoriel |
Description
Pipeline est un objet résultat, qui crée une nouvelle représentation graphique des résultats de l'analyse FEM sur la pièce analysée. Il ajoute une échelle de couleurs et des options d'affichage.
Utilisation
- Sélectionnez l'objet de résultat
- Cliquez sur le bouton
ou cliquez sur le menu Résultats et sur l'élément Post Pipeline from results. Un nouvel objet appelé "Pipeline" sera ajouté à votre document. notez si apparaît en dehors du conteneur d'analyse.
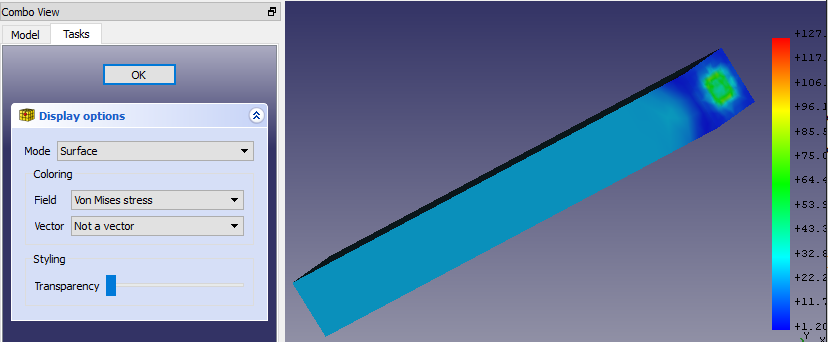
- Double-cliquez sur le nouvel objet Pipeline dans l’arborescence du modèle et sélectionnez le type de propriétés à afficher. Les paramètres typiques sont: Mode: Surface, Field: Stress Von Mises
- Mode: comment dessiner les résultats
- Field: Propriété de résultat à dessiner
- Vector: Si une propriété est un vecteur, vous pouvez limiter les données à un axe (X, Y, Z) ou sélectionner Magnitude pour utiliser la valeur du vecteur.
- Si vous ne voyez aucun modèle dans la zone graphique, allez dans et activez Edition → Préférences → Affichage → Rendu → Couleur du rétroéclairage.
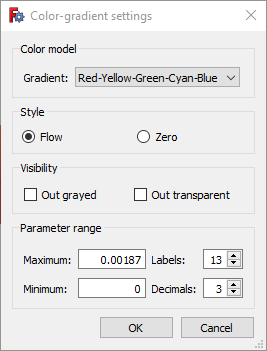
- Si vous double-cliquez sur l'échelle, vous pouvez modifier les propriétés d'affichage.
- Gradient: vous pouvez sélectionner l’ordre inversé du dégradé de couleur par défaut ou noir-blanc ou blanc-noir.
- Parameter range: les valeurs minimales et maximales sont automatiquement renseignées lorsque vous sélectionnez une propriété à évaluer sur l'objet Pipeline. vous pouvez les modifier, mais assurez-vous de savoir ce que vous faites. Vous pouvez également modifier le nombre d'étiquettes affichées et le nombre de décimales à afficher.
If you see no model in the graphical area, go to and enable Edit → Preferences → Display → 3D View → Rendering → Backlight color.
If you use a SI-derived FreeCAD unit system, the values in the output scale are based on SI units as well. This means the displacement is in meter, the stress is in Pascal and the temperature is in Kelvin.
Properties
Dialog
This pipeline dialog has the following settings:
- Mode: How to draw the results. The possible modes are
- Outline: The outline of the result mesh. In fact is displays no results but only the borders of the mesh
- Nodes: The result mesh nodes
- Surface: This is the default and displays the surface of the result mesh.
- Surface with Edges: Like Surface but with the mesh outline edges and the surface mesh node connection lines.
- Field: Which result property to draw
- Vector: Is only active if the Field is a vector. You can select whether to display the vector Magnitude or its X, Y, Z components.
Scale
If you double-click on the scale, you get this settings dialog:
and can modify these properties:
- Gradient: You can select reversed order of the default color gradient, Red-White-Blue, Black-White or White-Black.
- Style: The default option Flow uses the full color gradient range. The option Zero uses only the color gradient range starting form the color that would display the mean value to the maximum.
- Visibility: The option Out grayed will color all mesh nodes whose values are outside the set minimum/maximum range in gray. The option Out transparent will make these mesh nodes transparent.
- Parameter range: Minimum and maximum values are filled-in automatically. You can modify them, however make sure you know what you are doing. You can also change the number of displayed decimal places and the number of labels distributed over the parameter range.
Property Editor
In the property editor you can set in the View tab the settings from the dialog. In the Data tab you can additionally set this:
- DonnéesMode: How the filters used in the pipeline will be treated. These modes are possible:
- Serial: In this mode every filter takes the previous filter as input. The order is hereby the order of creation. The first created filter takes the pipeline as input. Its Input property is therefore empty.
- Parallel: In this mode all filters take the pipeline as input.
- Custom: introduced in version 0.20 This is the default and keeps the input of the filters as they are. Therefore it allows to have e.g. two filters that take the pipeline as input, and a third filter that takes one of the two filters as input.
Limitations
A nouveau, notez que la représentation des résultats (appelée VTK) par le pipeline sur la pièce affichée diffère des résultats du dégradé de couleur visibles lorsque vous terminez la solution. Les valeurs de l'échelle de dégradé ne peuvent pas être appliquées à l'objet résultat de la solution.
- Matériaux : Solide, Fluide, Mécanique non linéaire, Renforcé (type béton) ; Éditeur de matériaux
- Géométrie de l'élement : Poutre (1D), Rotation de poutre (1D), Coque (2D), Section fluide (1D)
Contraintes
- Électromagnétique : Potentiel électrostatique, Densité de courant, Magnétisation
- Géometrique : Rotation plane, Empreinte de section, Transformation
- Mécanique : Immobilisation, Déplacement, Contact, Liaison, Ressort, Force, Pression, Centrifuge, Poids propre
- Thermique : Température initiale, Flux de chaleur, Température, Source thermique
- Remplacer les Constantes : Permittivité du vide
- Maillage : Maillage Netgen, Maillage GMSH, Couche limite de maillage, Région de maillage, Groupe de maillage, Ensemble de nœuds, Maillage à maillage
- Solveur : CalculiX Standard, Elmer, Mystran, Z88 ; Équations : Déformation, Élasticité, Électrostatique, Force électrique, Magnétodynamique, Magnétodynamique 2D, Écoulement, Flux, Chaleur ; Solveur : Réglage du solveur, Calcul du solveur
- Résultats : Purger, Afficher ; Postprocessing : Appliquer les modifications, Pipeline du résultat, Filtre des déformations, Filtre d'écrêtage scalaire, Filtre de fonction de découpe, Filtre d'écrêtage selon une région, Filtre par contours, Filtre d'écrêtage selon une ligne, Graphique de linéarisation des critères, Données du filtre d'écrêtage du point, Filtre fonction plan, Filtre fonction sphère, Filtre fonction cylindre, Filtre fonction boîte
- Utilitaires : Plan de coupe, Supprimer les plans de coupe, Exemples ; Supprimer le maillage, Affichage des informations du maillage
- Additionnel : Préférences ; Installation, FEM Maillage, Solveur, CalculiX, FEM Béton ; FEM Types d'élements
- Démarrer avec FreeCAD
- Installation : Téléchargements, Windows, Linux, Mac, Logiciels supplémentaires, Docker, AppImage, Ubuntu Snap
- Bases : À propos de FreeCAD, Interface, Navigation par la souris, Méthodes de sélection, Objet name, Préférences, Ateliers, Structure du document, Propriétés, Contribuer à FreeCAD, Faire un don
- Aide : Tutoriels, Tutoriels vidéo
- Ateliers : Std Base, Arch, Assembly, CAM, Draft, FEM, Inspection, Mesh, OpenSCAD, Part, PartDesign, Points, Reverse Engineering, Robot, Sketcher, Spreadsheet, Surface, TechDraw, Test

